Compensation for sales roles across industries continued to evolve in 2026 as organizations balanced aggressive revenue targets with tighter budgets. To understand how compensation strategies are changing, Talentfoot analyzed anonymous responses from sales professionals across the U.S. and Canada. Respondents included both individual contributors and revenue leaders operating in complex B2B environments.
The data reflects a market where compensation remains competitive, but increasingly differentiated by role level, geography, and how risk is shared between sellers and organizations. Median base salaries across the sample skewed higher due to the seniority of respondents, with overall medians near $175,000 and median on-target earnings (OTE) near $275,000. Roughly 37 percent reported OTE above $300,000. Senior leaders such as VPs of Sales and CROs reported substantially higher median OTE, while individual contributors clustered closer to the $175,000 range.
These compensation patterns appeared directionally consistent across major markets including Chicago, New York, Austin, Dallas, Southern California, Atlanta, and Toronto. Across regions and role types, competitive OTE continues to influence candidate decision-making, though the data suggests sellers are increasingly weighing base salary, plan credibility, and non-monetary factors alongside headline earnings when evaluating new opportunities.
Survey Demographics: A Snapshot of The 2025 Sales Talent
Survey respondents represent a senior, nationally distributed pool of sales talent.
Attribute | Key Strength |
Geography | 30+ states/provinces; largest in FL, IL, NY, CA, TX |
Experience | 71% with 10+ years |
Role Level | 67% leadership, ~33% IC |
Company Size | 87% with 50+ employees |
Core Sales Compensation Benchmarks for 2026: Base, OTE, and Quota
The market continues to support strong earning potential for experienced sellers, particularly at the leadership level.
Median base salary and OTE figures across the sample skewed higher due to the seniority of respondents, with overall medians near $175,000 in base pay and $275,000 in on-target earnings (OTE). Nearly one in five respondents reported OTE above $300,000, reflecting the growing concentration of compensation at senior levels.
Quota expectations have risen alongside earnings potential, with nearly two thirds of respondents carrying annual quotas above $1 million, underscoring the increasing scale and complexity of modern sales roles.
As expected, senior job titles such as Vice President of Sales and Chief Revenue Officer corresponded with the highest levels of compensation, while individual contributors clustered meaningfully below leadership benchmarks.
Sales Compensation Benchmarks by Role Level
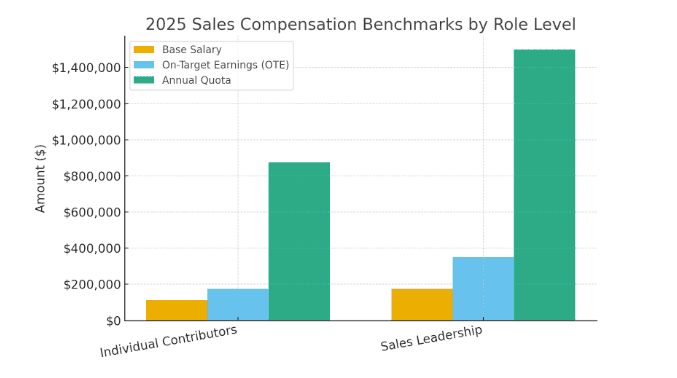
Leadership roles command materially higher earning potential than individual contributor roles, with on-target earnings increasing significantly at the director, vice president, and CRO levels. This pattern appears consistent across U.S. and Canadian respondents, reflecting the greater scope, accountability, and influence associated with senior sales roles.
In major markets such as New York, Chicago, Toronto, and Southern California, competitive variable compensation remains an important component of senior-level offers. However, the data suggests that experienced sales leaders increasingly evaluate opportunities holistically, weighing base salary, incentive credibility, and long-term alignment alongside headline OTE when deciding whether to engage or commit.
Pay Mix and Performance in 2025
Across the sample, compensation structures clustered around a balanced mix of base and variable pay, with roughly half of respondents reporting plans near a 50/50 split. Individual contributors tended to skew slightly more variable, while managers and senior leaders trended modestly more base heavy, reflecting differences in role scope and risk exposure. While the directional pattern is clear, the differences between groups were incremental rather than extreme.
Quota expectations were elevated across roles, with nearly two thirds of respondents carrying annual targets above $1 million. Approximately 71 percent reported hitting or exceeding quota in the prior year. While headline attainment rates appeared similar between individual contributors and leaders, the data suggests different underlying dynamics, with individual contributors reporting higher compensation dissatisfaction when targets were missed, particularly in longer-cycle, multi-stakeholder environments.
Approximately 71 % of sales executives reported hitting or exceeding quota in the prior year.
Pay Mix & Performance
Metric | IC Roles | Leadership |
Base as % of OTE | ~50% | ~53% |
Variable as % of OTE | ~50% | ~47% |
% Meeting or Exceeding Quota | ~71% | ~74% |
At a surface level, performance outcomes suggest that many organizations continue to set achievable targets. However, the data indicates that quota attainment alone is no longer a reliable signal of balance. As selling environments grow more complex and cycles lengthen, similar attainment rates can mask meaningful differences in controllability, enablement, and seller experience.
In this context, sales professionals increasingly scrutinize upside not simply as a reward for performance, but as compensation for the risk they absorb. Meaningful upside remains important, but it is evaluated alongside quota credibility, timing of payout, and the degree to which sellers believe outcomes are within their influence.
What Sales Talent Value Most in Their Compensation Plans
Respondents ranked several aspects of their compensation in order of concern. The top two issues were insufficient incentives and base salary, followed by transparency, fairness, and non-monetary incentives.
While plan complexity did not emerge as a primary stated concern, the broader data suggests it remains an underlying factor in how sellers experience compensation. Many respondents who cited insufficient incentives also reported low confidence in incentive effectiveness, delayed payouts, or difficulty understanding how rewards were earned. Rather than signaling a shift toward predictability, this pattern suggests that incentive design and credibility increasingly determine whether compensation feels motivating or fragile in practice.
Compensation Concerns (Ranked)
Aspect | Concern Level |
Insufficient incentives | Highest |
Base salary | High |
Transparency | Modertly High |
Non-monetary incentives | Moderate |
Perceived fairness | Moderately Low |
Payout timing | Low |
Plan complexity | Lowest |
When evaluating a potential role, respondents rated increases in variable compensation and base salary as similarly influential, both scoring highly on a five-point scale. Financial upside continues to play a central role in initial decision-making.
Non-monetary incentives were also widely valued, particularly as factors influencing long-term commitment rather than initial attraction. Elements such as flexibility, quality of leadership, and professional development emerged as critical in shaping whether sellers remain engaged through extended sales cycles and delayed outcomes.
For Employers Competing for Sales Talent in 2026
The data reveals several consistent themes.
- Competitive base salary and on-target earnings remain foundational across the major markets represented in the study. Candidates are highly sensitive to compensation that falls below perceived market ranges and often deprioritize roles early in the evaluation process when pay does not align with expectations.
- Compensation structures across respondents frequently clustered around a balanced base and variable mix, with many reporting plans near a 50/50 split. While this structure remains familiar, the data suggests its effectiveness depends less on the ratio itself and more on quota credibility, cycle length, and the degree of control sellers feel they have over outcomes.
- Non-monetary incentives have become part of competitive positioning rather than secondary perks. Flexibility, reduced travel, and professional development opportunities consistently influenced decision-making, particularly when financial offers were otherwise comparable.
- Transparency in compensation design emerged as an important trust signal. Clear communication around quotas, accelerators, and payout mechanics helps candidates evaluate risk and commit with greater confidence, especially in longer sales cycles.
Taken together, the data points to a sales talent market motivated by both earning potential and the overall work experience. Top performers continue to expect competitive OTE, but they are also choosing employers that offer flexibility, credible compensation structures, and visible investment in their development. Organizations that align pay, transparency, and work design with these expectations are better positioned to attract and retain strong sales talent in the year ahead.