

In September 2025, Talentfoot reviewed leading SaaS benchmarking studies to evaluate how executive hires affect performance. This analysis compares time-to-impact, tenure, and ROI expectations for SaaS executives, while defining the unique leadership challenges in subscription-based businesses. It provides a data-backed framework for boards and CEOs to set realistic expectations and measure return on executive leadership investments.
How Long Does it Take for SaaS Executives to Ramp? What is the Average SaaS Executive Tenure?
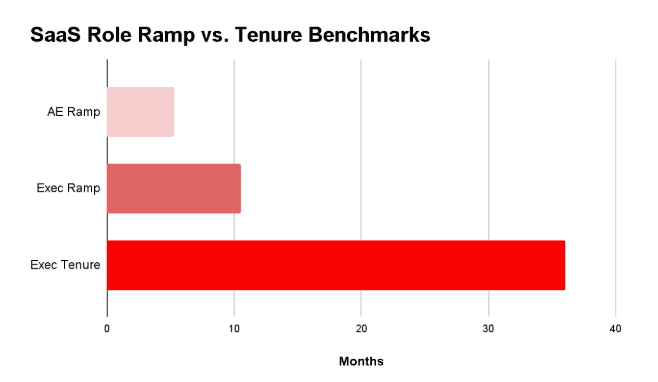
Executives take months to ramp into their role but often leave before ROI is visible. Account Executives typically ramp in about 5.3 months [1], while senior executives such as CROs or COOs may take 9–12 months [2]. Yet average tenure for SaaS CRO/CMO roles is often under three years [3].
This mismatch between time-to-impact and tenure creates a structural challenge in SaaS leadership. Leaders are expected to deliver growth and retention quickly, yet the data shows they require nearly a year before impacting metrics in a measurable way.
Because of this disconnect, boards and executives expecting quick wins may never realize leadership ROI. However, a strong onboarding program can mitigate hiring risk and radically improve the return on hiring investment. For example, businesses with a smooth onboarding process boost their employee retention rates by 52% while, an effective onboarding journey is correlated with revenue growth of 2.5x [8]. However, a recent survey found that only 52% of new hires feel satisfied with their onboarding experience, with 32% finding it confusing and 22% disorganized. Remote workers fare worse, with 36% of them finding the process “baffling” [9].
Defining Core Metrics in SaaS
To measure ROI consistently, boards need clear definitions of SaaS performance metrics. Without shared understanding, leadership goals can become arbitrary or unrealistic. The four most important metrics include:
- ARR (Annual Recurring Revenue): Predictable subscription revenue recognized annually.
- NRR (Net Revenue Retention): Revenue kept from existing customers after expansions, downgrades, churn. >100% = growth.
- GRR (Gross Retention): Revenue kept without expansions.
- Churn: Percentage of revenue/customers lost. SaaS average ~3.5% annually [5].
SaaS executives in sales, revenue, and customer success are judged by how they move these indicators, often within their first year of tenure.
SaaS Performance Benchmarks
Benchmarks provide context for standard performance at different stages of SaaS growth. They help boards evaluate whether executives are underperforming, meeting expectations, or best-in-class.
Metric | Benchmark | Source |
NRR | ~104% (90th percentile ~118%) | SaaS Capital [4] |
GRR | ~92% (top quartile ~98%) | SaaS Capital [4] |
CH | ~3.5% overall | Vitally [5] |
Growth (bootstrapped $3–20M ARR) | ~20% | SaaS Capital [6] |
Growth (public SaaS) | ~30% (down from ~35%) | Vena Solutions [7] |
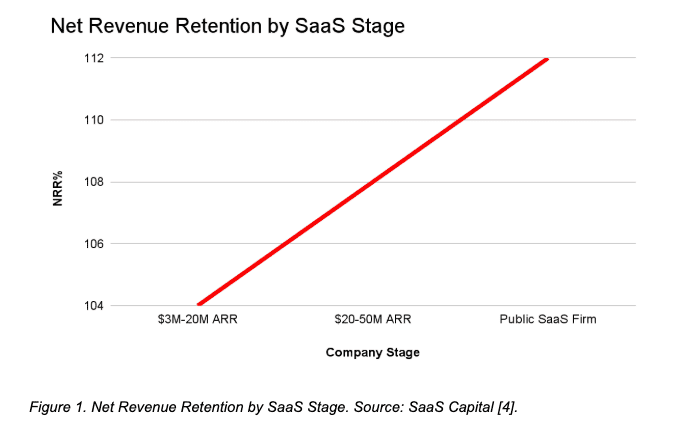
One of the most telling ways to understand how expectations change as SaaS companies mature is through net revenue retention (NRR). Smaller, bootstrapped companies often struggle just to stay above 100%, while larger, later-stage firms are expected to drive expansion well beyond that baseline.
Cost vs. Value of Executive Hires
Hiring executives is costly, but the potential upside can be quantified. The downside of hiring new executives include search fees (20–35% of first-year comp), onboarding delays, and team disruption [2]. Yet even modest improvements in key metrics from a successful hire can outweigh these costs.
Scenario | Impact on ARR | Explanation |
Reduce churn 5% → 3% on $100M ARR | +$2M ARR preserved | Fewer customers lost |
Improve NRR 104% → 110% | Expansion + valuation boost | Stronger upsell motion |
Accelerate growth +10 pts (20% → 30%) | +$10M ARR growth (on $100M base) | Faster topline expansion |
For example, a $50M ARR company reducing churn from 5% to 3% preserves $1M annually. At a 10x revenue multiple, that translates to $10M in enterprise value, far outweighing the executive’s compensation package.
Gaps in Available SaaS Hiring Data
Despite robust SaaS benchmarks, executive-specific data remains scarce. Boards often lack visibility into three critical areas:
- Executive turnover rates: Surveys show CRO/CMO roles often churn quickly, but quantified SaaS-specific rates are limited [3].
- Time-to-impact: While AEs ramp in ~6 months [1], data from Talentfoot shows that Account Executives who rank in the top 10% of historical quota attainment and whose skill-set and experience matches the go-to-market strategy and plan of the employer can accelerate time-to-revenue by 20% or more [10]. This needs to be studied in greater detail and on a wider-scale across geographies, sub-industries, roles, and company size and stages.
- Compensation vs. performance: Public disclosures give salary/equity data, but benchmarks by stage remain thin.
These gaps matter. Without reliable benchmarks, boards risk misaligned expectations, premature turnover, and wasted hiring cycles. It’s critical that companies work with executive search firms, like Talentfoot, to set these benchmarks ahead of the hiring process to align reasonable expectations with company leadership and their eventual hire to ensure the turnover cycle is shortened.
Framework for Boards and CEOs
To avoid premature turnover, boards need a structured way to evaluate executives:
- Set a reasonable timeline: Expect 6–12 months before measurable impact.
- Clarify levers: Define accountability (ARR growth vs churn vs margin).
- Stage-adjust: Benchmarks differ at $10M ARR vs $200M ARR.
- Tie comp to outcomes: Link bonuses to retention or NRR improvements.
This framework aligns expectations with reality, preventing costly missteps and improving retention of executive talent.
Building Sustainable SaaS Leadership
SaaS organizations invest heavily in leadership, but ROI depends on patience, stage-adjusted goals, and the right data. By applying benchmarks for ramp time, tenure, churn, and NRR, boards can set clearer expectations and give leaders the runway to succeed.
Talentfoot applies this metrics-driven approach, helping clients align expectations, benchmark peers, and hire executives positioned to deliver measurable ROI.
Sources
- Jiminny. (2024). 7 SaaS Sales Benchmarks for Leaders and AEs in B2B. Retrieved from https://jiminny.com/blog/saas-sales-benchmarks
- Industry Practitioner Surveys. (2025). Executive Ramp Times. Retrieved from https://blossomstreetventures.medium.com/saas-account-executive-performance-data-321a6ceec9db
- Market Reports. (2023–24). Executive Turnover in SaaS. Retrieved from https://marketproinc.com/hiring-advice-2/2024/12/short-tenure-of-cmos
- SaaS Capital. (2025). Benchmarking Metrics for Bootstrapped SaaS Companies. Retrieved from https://www.saas-capital.com/blog-posts/benchmarking-metrics-for-bootstrapped-saas-companies
- Vitally. (2025). SaaS Churn Benchmarks & Insights. Retrieved from https://www.vitally.io/post/saas-churn-benchmarks
- SaaS Capital. (2023). B2B SaaS Retention Benchmarks. Retrieved from https://www.saas-capital.com/wp-content/uploads/2023/05/RB28WS1-2023-B2B-SaaS-Retention-Benchmarks.pdf
- Vena Solutions. (2024). Public SaaS Growth Benchmarks. Retrieved from https://www.venasolutions.com/resources/saas-growth-benchmarks
- Devlin Peck (2025). Employee Onboarding Statistics in 2025. Retrieved from https://www.devlinpeck.com/content/employee-onboarding-statistics
- Paychex (2023). The Effect of Poor Onboarding on New Hires. Retrieved from https://www.paychex.com/articles/human-resources/the-onboarding-crisis
- Talentfoot (2025). Account Executive Performance Review – Internal data review of account executives candidate ranking and sales performance with new employers.